SOME RESULTS
Statistical Downscaling
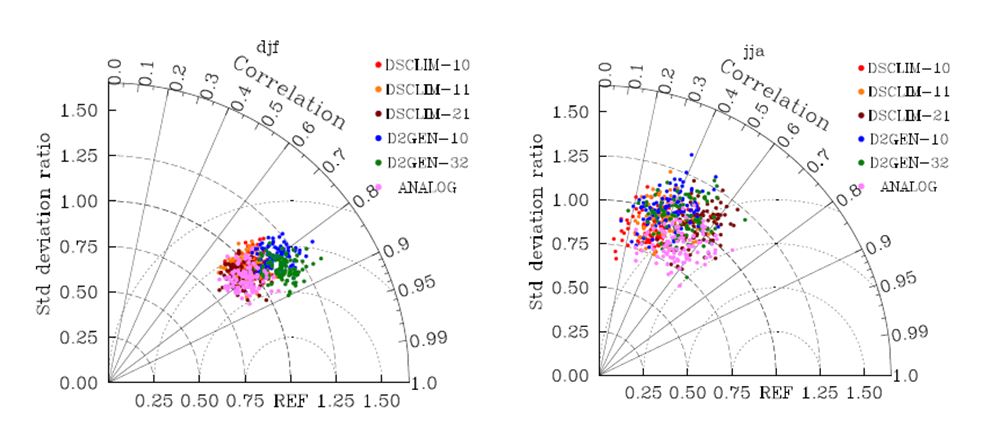
The different versions of the 3 SDMs considered in the project are not equivalent. They rather well reproduce chronological variations of local meteorological variables. The evaluation of their temporal transferability is not easy as a result of temporal heterogeneity in data.
 >
>
Figure1: Taylor diagrams : Ability of SDMs for the reproduction of seasonal precipitation time series (left : winter, right : summer).(extracted from Lafaysse et al. 2014)
Modelling the Management of the Serre Ponçon Reservoir system
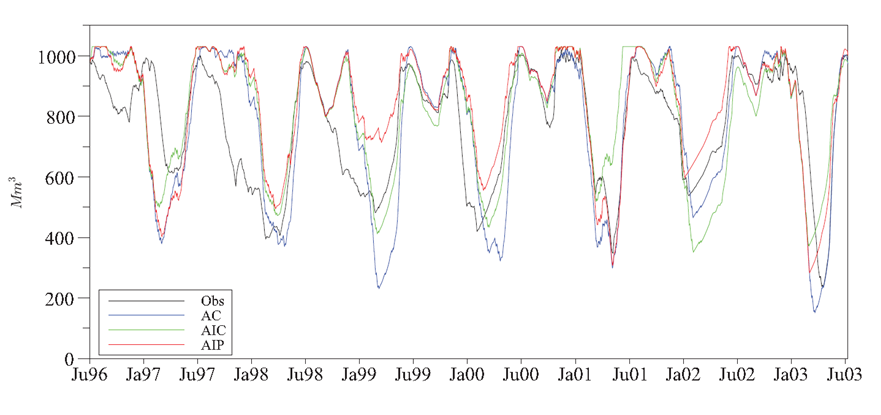
An integrated model was developed for the simulation of the current management of the reservoir. It allows evaluating the sustainability of the system by comparison of the performance of an optimal management strategy for past and future periods. The strategy results from the identification of dates and water uses for which it is most interesting to allocate a part of the resource. This strategy is obtained from dynamic programming so as to account for multiple objectives and constraints (low flow maintenance, agriculture, drinking water, hydroelectricity production, summer tourism).
 >
>
Figure2: Observed (black) and simulated trajectories of water storage in the Serre Ponçon reservoir for 3 management models corresponding to 3 different storage strategies.
Future projections and uncertainties
Mean expected changes, total uncertainty and the contribution of the different uncertainty sources was estimated with the QEANOVA statistical framework developed within RIWER2030. They are illustrated for changes in annual temperature and precipitation in Figure 3. Main results of the analysis are :
- SDM uncertainty is of same order to that GCM. For the present dataset, it was even found to be greater for precipitation during the whole simulation period and for temperature during some decades in the middle of the century.
- Internal variability is the main component of total uncertainty, especially for the first decades. It rapidly decreases to less than 10% at the end of the century for temperature. It roughly always remains the main uncertainty component for precipitation.
- The small scale component of internal variability is negligible for temperature. It is however of the same order than the large scale component for precipitation, whatever the projection lead time.
- The response-to-uncertainty ratio at the 90% confidence level is very high for temperature and related hydrometeorological variables, whatever the lead time. Its absolute value is conversely always much smaller than one for precipitation and in a less extent, indicating that even the sign of precipitation change is uncertain.
- The time of emergence of change due to global warming is found to be as soon as the first decade for regional temperature but is not expected to be within this century for precipitation.
- For the considered future scenarios, the estimated performance of the system is fairly independent on the way the optimal strategy is identified. It globally tends to decrease. (Figure 4).
Main implications are : multimodel (GCMs and Downscaling Models) experiments became a standard in Climate change impact studies. Another standard should be to rely on multimember experiments. Impact studies based on single members of SDMs or RCMs experiments (or small ensembles) are likely to be not more relevant than those based on single runs of available GCMs (or small ensembles). When they are intended to provide information for climate change adaptation, they may lead to poor decisions. A relevant strategy would be, in the present case, to adapt to internal variability of precipitation.
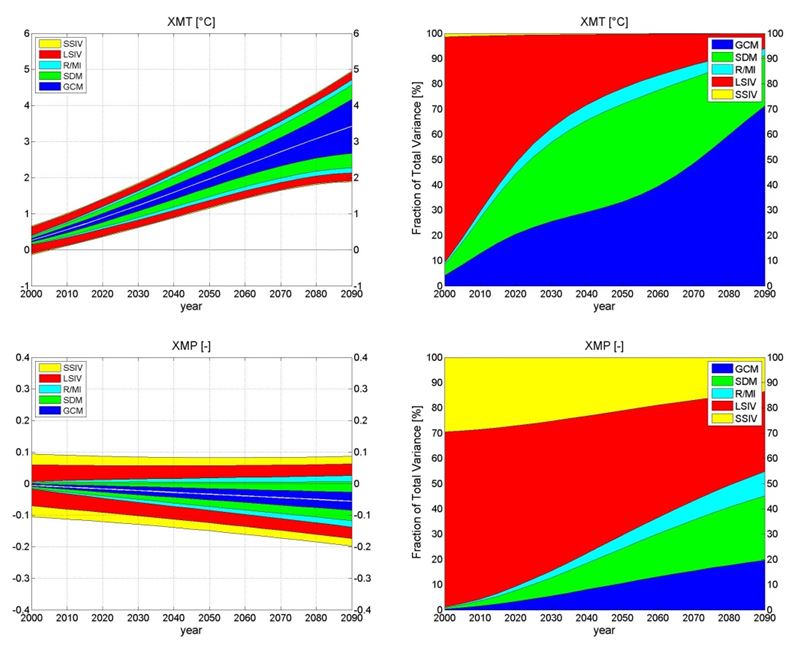
Figure3: Left : Expected climate change response and total uncertainty in 20-yr mean temperature and precipitation projections for the Upper Durance River Catchment as a function of projection lead time (reference period 1980--1999).}. The total colored area covered by all uncertainty components corresponds to 90% confidence interval. The time axis gives the midpoint of the averaging future period. Uncertainty components are shown in dark blue for GCM uncertainty, green for SDM uncertainty, cyan for Residuals/Model Interaction (R/MI), red for large scale internal variability (LSIV) and yellow for small scale internal variability (SSIV) of the GCM/SDM chains. Right : Fraction of total variance explained by each source of uncertainty (extracted from Hingray et Saïd, 2014).
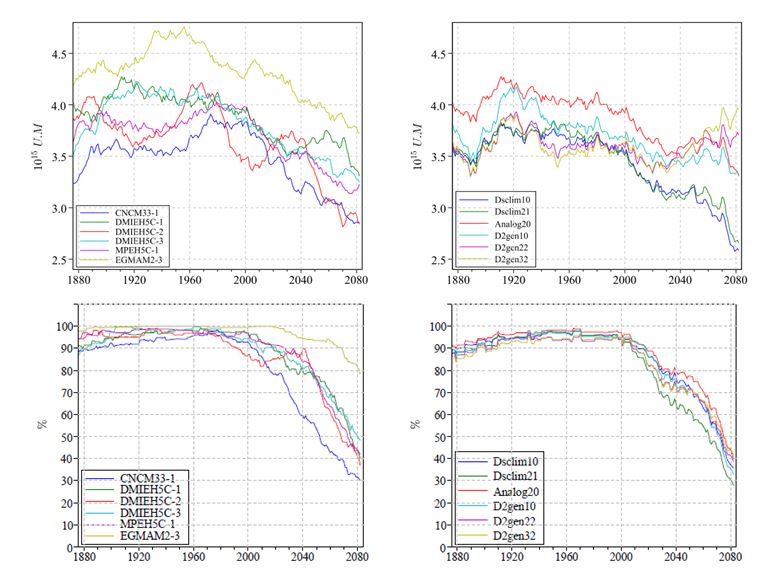
Figure4: Time evolution (1860 à 2099) of hydropower production income index (30-yrs mean) (top) and of reliability index relative to the maintenance of a summer water level for tourism (bottom). (a) 6 GCM forcing the downscaling model Analog20. (b) 6 downscaling models forced by GCM DMIEH5C-1 (François, 2013).